Status: Done started: 2018-Jul-29 15:46:20 UTC
| Project Name | |
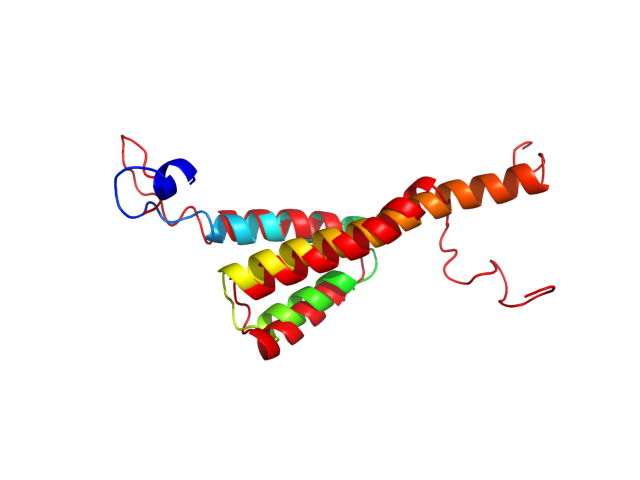
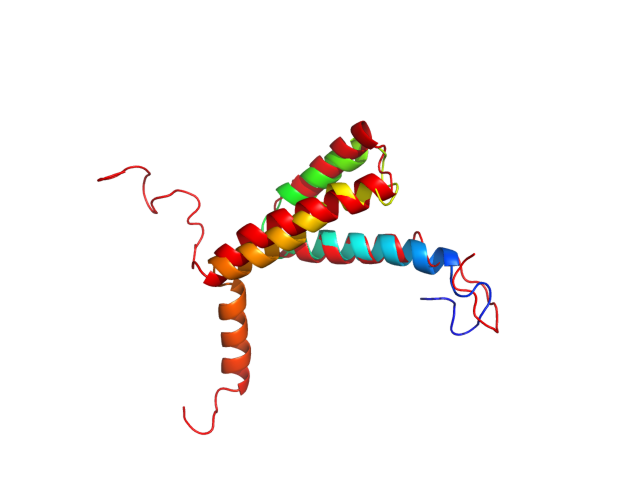
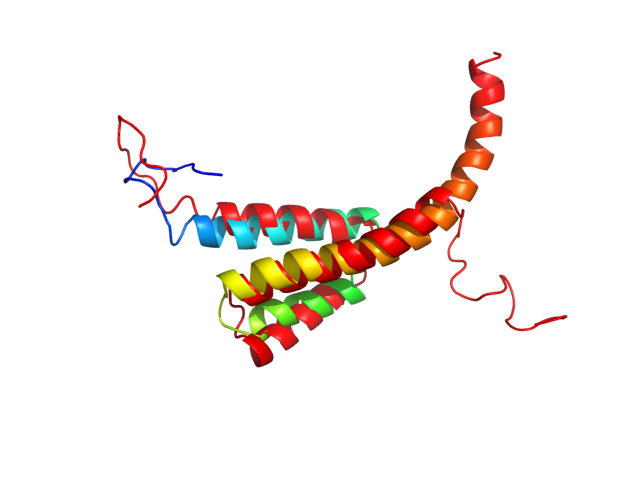
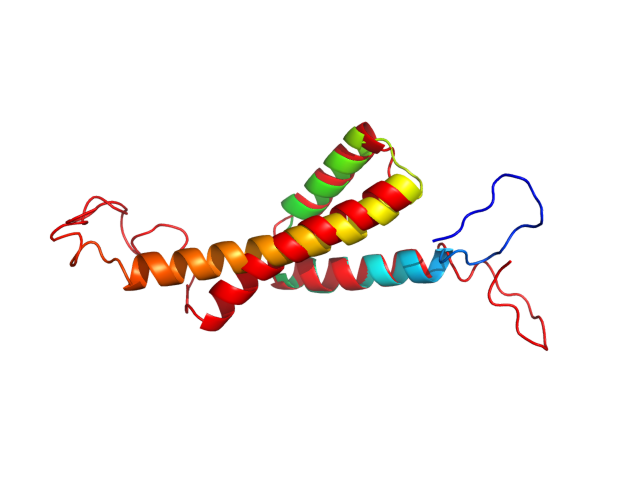
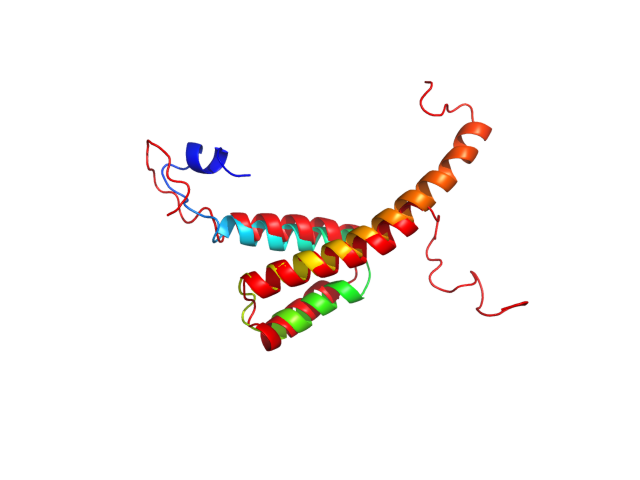
| Sequence | MEQAPEDQGP PREPYNEWML ELLEDLKHEA VRHFPRPWLH GLGQHIYNTY GDTWEGVEAI IRILQQLLFV HFRIGCQHSR IGIIPGRRGR DGSGRP |
| Secondary structure | CCCCCCCCCC CCCCCCCHHH HHHHHHHHHH HHHCCCCHHH HHHHHHHHHC CCCHHHHHHH HHHHHHHHHH HHHHHHHCCC CCCCCCCCCC CCCCCC |
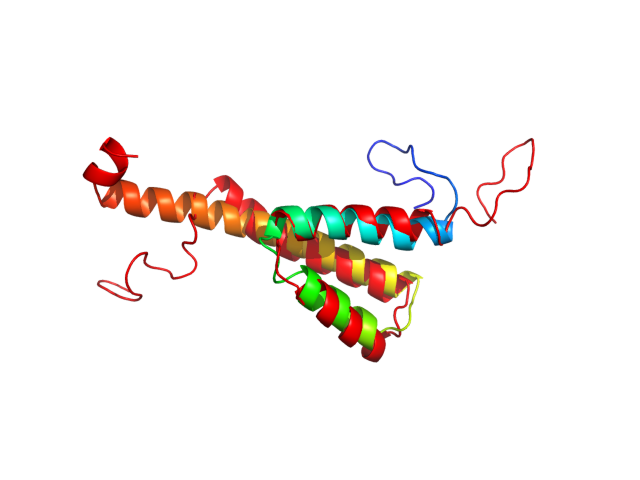
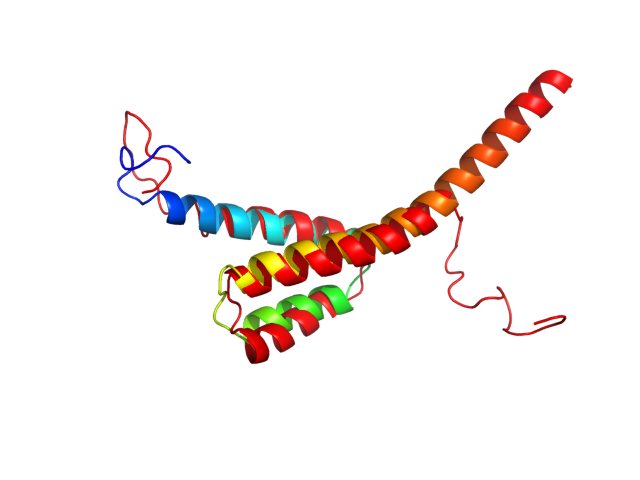
| Movie from predicted structures | To download the movie, right click on the desired file format:  
|
| Estimated finish time | 2018-Jul-29 20:17 UTC |
| Project Name |
| Project Name |
| Cluster # | 1 | 2 | 3 | 4 | 5 | 6 | 7 | 8 | 9 | 10 | 11 | 12 |
| Cluster density | 129.4 | 93.1 | 84.1 | 69.2 | 66.5 | 63.1 | 61.2 | 40.4 | 39.0 | 30.5 | 26.4 | 23.1 |
| Cluster size | 355 | 225 | 244 | 135 | 187 | 225 | 174 | 110 | 122 | 74 | 69 | 80 |
| Average cluster RMSD | 2.7 | 2.4 | 2.9 | 1.9 | 2.8 | 3.6 | 2.8 | 2.7 | 3.1 | 2.4 | 2.6 | 3.5 |
| # | 1 | 2 | 3 | 4 | 5 | 6 | 7 | 8 | 9 | 10 | 11 | 12 |
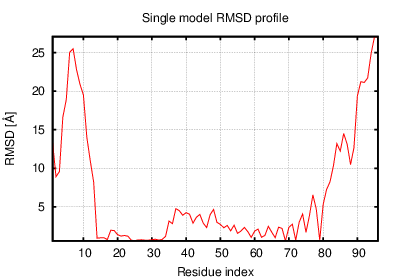
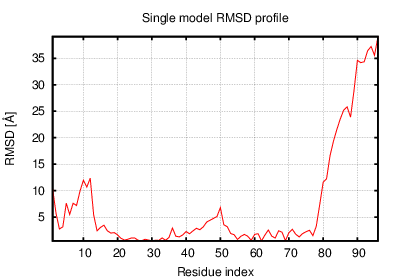
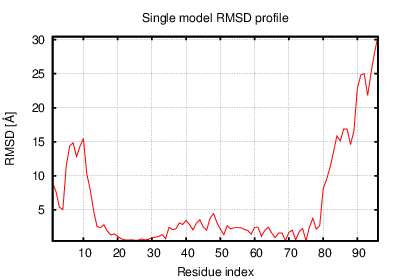
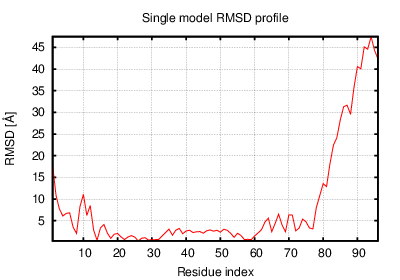
| RMSD | 8.90 | 8.90 | 7.13 | 8.56 | 8.59 | 7.06 | 10.90 | 11.80 | 9.17 | 9.41 | 6.87 | 10.10 |
| GDT_TS | 0.58 | 0.54 | 0.53 | 0.50 | 0.56 | 0.55 | 0.49 | 0.46 | 0.52 | 0.50 | 0.49 | 0.54 |
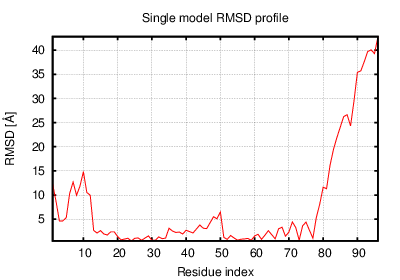
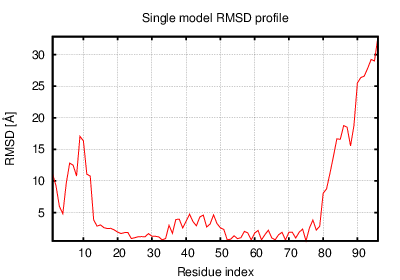
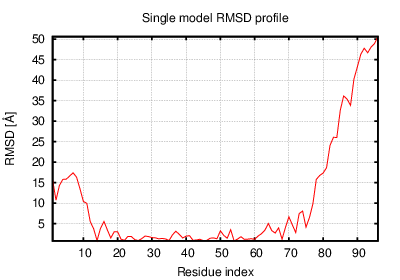
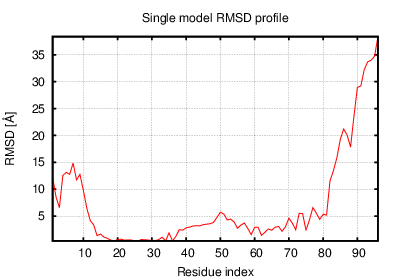
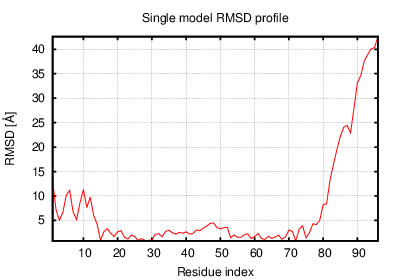
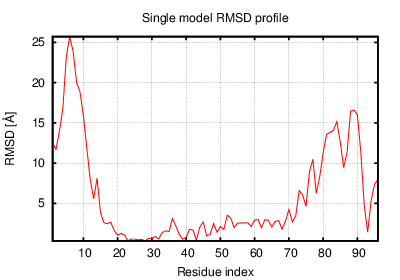
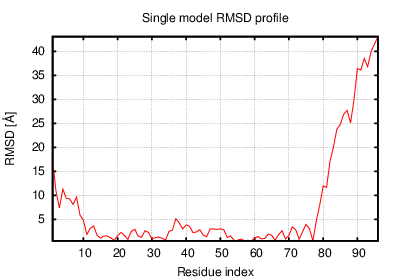
The table contains RMSD and GDT_TS values (calculated on the Cα atoms) between the predicted models and the input structure. Note that GDT_TS metric is intended as a more accurate measurement than the more common RMSD.
Read more about the root-mean-square deviation (RMSD) measure
Read more about the global distance test (GDT, also written as GDT_TS to represent "total score") measure.
| # | 1 | 2 | 3 | 4 | 5 | 6 | 7 | 8 | 9 | 10 | 11 | 12 |
| 1 | 0.00 | 2.95 | 3.47 | 5.37 | 3.69 | 4.31 | 6.05 | 8.59 | 3.90 | 5.00 | 8.00 | 5.35 |
| 2 | 2.95 | 0.00 | 3.54 | 5.61 | 2.72 | 4.29 | 5.01 | 7.35 | 2.87 | 3.35 | 8.75 | 4.43 |
| 3 | 3.47 | 3.54 | 0.00 | 5.38 | 3.64 | 2.43 | 7.08 | 9.09 | 4.42 | 4.89 | 6.65 | 6.33 |
| 4 | 5.37 | 5.61 | 5.38 | 0.00 | 6.55 | 5.21 | 7.61 | 9.43 | 4.63 | 6.16 | 8.29 | 5.90 |
| 5 | 3.69 | 2.72 | 3.64 | 6.55 | 0.00 | 4.27 | 5.54 | 7.54 | 4.27 | 3.56 | 8.28 | 5.24 |
| 6 | 4.31 | 4.29 | 2.43 | 5.21 | 4.27 | 0.00 | 7.69 | 9.44 | 4.87 | 5.38 | 6.14 | 6.48 |
| 7 | 6.05 | 5.01 | 7.08 | 7.61 | 5.54 | 7.69 | 0.00 | 4.56 | 4.96 | 4.34 | 11.50 | 4.92 |
| 8 | 8.59 | 7.35 | 9.09 | 9.43 | 7.54 | 9.44 | 4.56 | 0.00 | 7.13 | 6.17 | 12.80 | 6.76 |
| 9 | 3.90 | 2.87 | 4.42 | 4.63 | 4.27 | 4.87 | 4.96 | 7.13 | 0.00 | 3.36 | 9.23 | 4.23 |
| 10 | 5.00 | 3.35 | 4.89 | 6.16 | 3.56 | 5.38 | 4.34 | 6.17 | 3.36 | 0.00 | 9.57 | 3.96 |
| 11 | 8.00 | 8.75 | 6.65 | 8.29 | 8.28 | 6.14 | 11.50 | 12.80 | 9.23 | 9.57 | 0.00 | 10.00 |
| 12 | 5.35 | 4.43 | 6.33 | 5.90 | 5.24 | 6.48 | 4.92 | 6.76 | 4.23 | 3.96 | 10.00 | 0.00 |
The table contains RMSD values (calculated on the Cα atoms) between the predicted models.
Read more about the root-mean-square deviation (RMSD) measure.
| # | 1 | 2 | 3 | 4 | 5 | 6 | 7 | 8 | 9 | 10 | 11 | 12 |
| 1 | 1.00 | 0.69 | 0.65 | 0.54 | 0.69 | 0.61 | 0.49 | 0.47 | 0.57 | 0.54 | 0.56 | 0.62 |
| 2 | 0.69 | 1.00 | 0.66 | 0.59 | 0.79 | 0.63 | 0.55 | 0.49 | 0.69 | 0.67 | 0.54 | 0.71 |
| 3 | 0.65 | 0.66 | 1.00 | 0.65 | 0.65 | 0.76 | 0.51 | 0.47 | 0.58 | 0.61 | 0.65 | 0.57 |
| 4 | 0.54 | 0.59 | 0.65 | 1.00 | 0.58 | 0.73 | 0.47 | 0.42 | 0.61 | 0.60 | 0.55 | 0.55 |
| 5 | 0.69 | 0.79 | 0.65 | 0.58 | 1.00 | 0.66 | 0.54 | 0.51 | 0.62 | 0.67 | 0.55 | 0.67 |
| 6 | 0.61 | 0.63 | 0.76 | 0.73 | 0.66 | 1.00 | 0.49 | 0.45 | 0.60 | 0.62 | 0.57 | 0.57 |
| 7 | 0.49 | 0.55 | 0.51 | 0.47 | 0.54 | 0.49 | 1.00 | 0.58 | 0.51 | 0.55 | 0.43 | 0.56 |
| 8 | 0.47 | 0.49 | 0.47 | 0.42 | 0.51 | 0.45 | 0.58 | 1.00 | 0.46 | 0.47 | 0.45 | 0.53 |
| 9 | 0.57 | 0.69 | 0.58 | 0.61 | 0.62 | 0.60 | 0.51 | 0.46 | 1.00 | 0.72 | 0.49 | 0.61 |
| 10 | 0.54 | 0.67 | 0.61 | 0.60 | 0.67 | 0.62 | 0.55 | 0.47 | 0.72 | 1.00 | 0.49 | 0.63 |
| 11 | 0.56 | 0.54 | 0.65 | 0.55 | 0.55 | 0.57 | 0.43 | 0.45 | 0.49 | 0.49 | 1.00 | 0.51 |
| 12 | 0.62 | 0.71 | 0.57 | 0.55 | 0.67 | 0.57 | 0.56 | 0.53 | 0.61 | 0.63 | 0.51 | 1.00 |
The table contains GDT_TS values (calculated on the Cα atoms) between the predicted models.
Read more about the global distance test (GDT, also written as GDT_TS to represent "total score") measure.
© Laboratory of Theory of Biopolymers, Faculty of Chemistry, University of Warsaw 2013